


Introduction to Dashboard
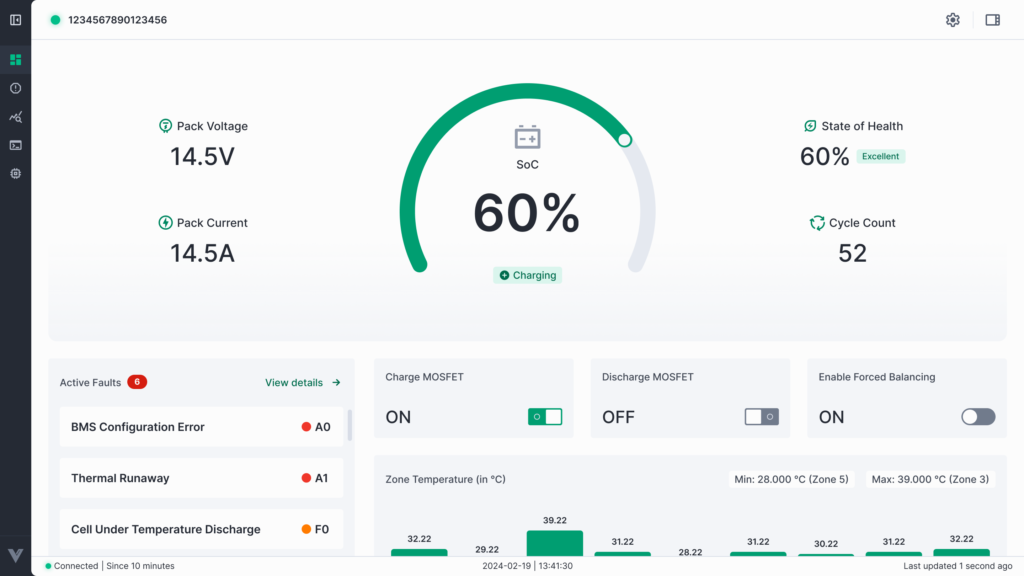
The Dashboard is the central hub of Battery Buddy where you can monitor critical battery data in real-time and control key functions of the battery system. It is designed to give you a comprehensive snapshot of system health, performance, and safety alerts — all in one place.
The dashboard is divided into several interactive tiles/widgets, each serving a specific purpose:
- Device Overview
- Active Faults
- Control Center (MOSFET & Balancing)
- Zone Temperature
- Cell Voltages
- Device Status Ribbon
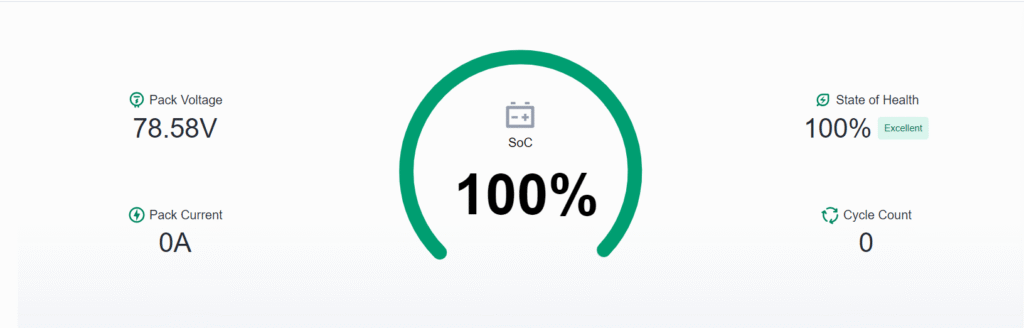
Device Overview
The Device Overview widget shows real-time values for:
- Pack Voltage
- Pack Current
- State of Charge (SoC)
- State of Health (SoH)
- Cycle Count
- Charging Status
SoC Bar Color Guide
The State of Charge (SoC) indicator bar changes color based on the current SoC value:
| SoC Range | Bar Color |
| 0% – 20% | Red |
| 21% – 50% | Orange |
| 51% – 100% | Green |
Active Fault
The Active Faults tile displays all current faults detected in the battery system.
Fault Details Displayed in the Tile:
- Total number of active faults — shown in a red pill counter
- Fault Name and Fault Code (e.g., Cell Over Voltage – F2)
- Severity Level — represented using color-coded indicators:
- 🔴 Red (Alert) – Critical fault
- 🟠 Orange (Fault) – Warning-level fault
- 🟡 Yellow (Precaution) – Informational or precautionary status
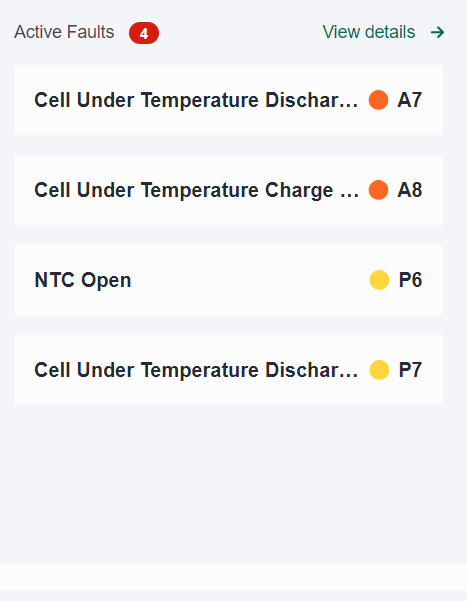
Click View details to access the full Faults screen, where you can:
- See detailed fault logs
- Understand severity levels
- Download the full fault list
- Clear permanent faults (if applicable)
For a detailed breakdown, refer to the Faults Section.
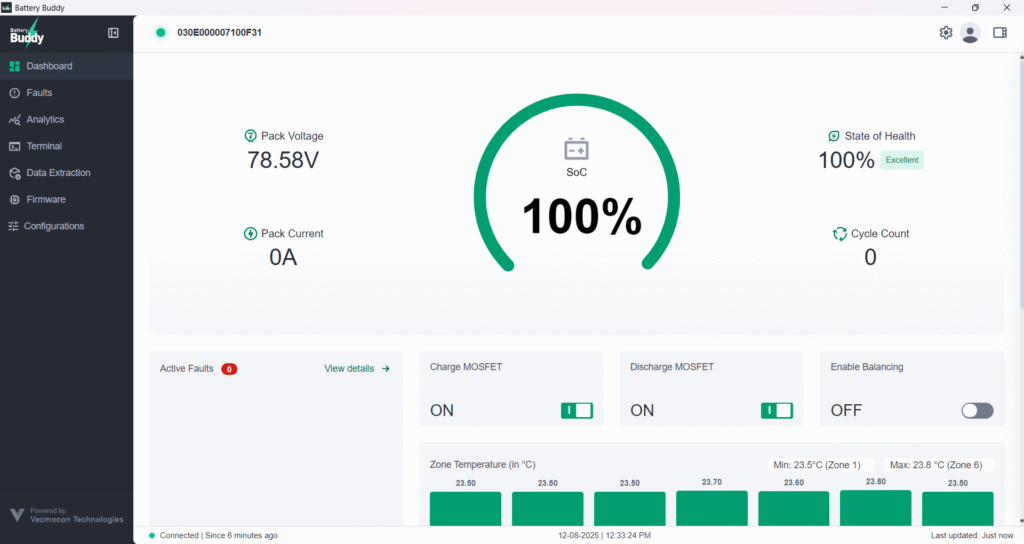
Control Center – MOSFETs & Forced Balancing
The Control Center section of the dashboard allows you to manually operate two key battery management components:
- Charge MOSFET
- Discharge MOSFET
These toggles are especially useful during diagnostics, manual overrides, or controlled test conditions.
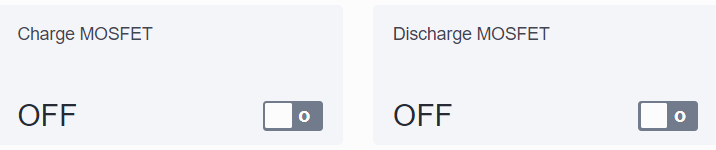
Charge & Discharge MOSFETs
Battery Buddy provides one-click toggle switches to control:
- Charge MOSFET – Enables or disables the charging circuit.
- Discharge MOSFET – Enables or disables the discharging circuit.
Behavior:
- When toggled ON, the path is active and battery charge/discharge is allowed.
- When toggled OFF, the circuit is disabled — preventing flow.
Note: You must have an active connection to the battery device for these controls to function.
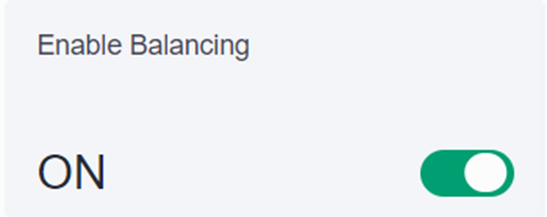
Enabling Forced Balancing
Forced Balancing is a manual cell-balancing feature available during the charging phase. It is useful when automatic balancing is insufficient or delayed due to cell mismatch.
To enable Forced Balancing:
- Navigate to the Dashboard.
- Locate the Enable Balancing switch below the overview area.
- Toggle it to ON.
Note: Forced balancing is only available during charging and when no critical fault is active. If a fault is triggered, balancing will automatically turn OFF.
When enabled, cells undergoing balancing will be highlighted in the Cell Voltage widget using animated visual indicators.
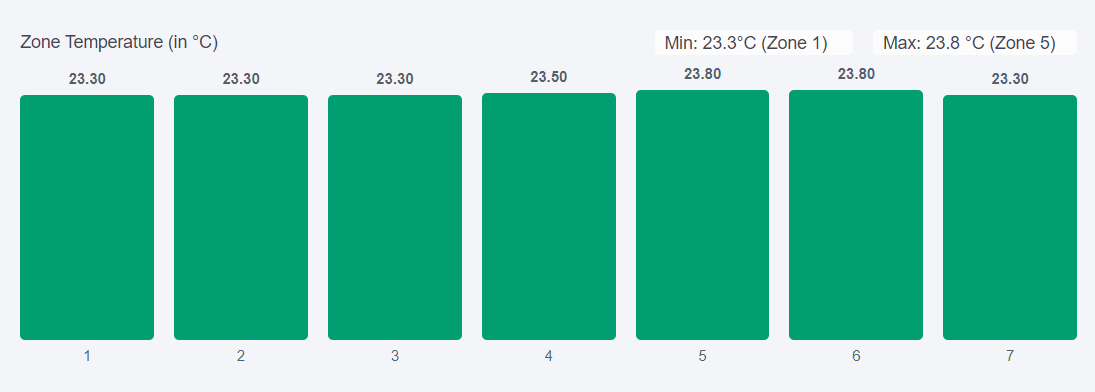
Zone Temperature
The Zone Temperature widget displays the real-time thermal profile of the battery pack by monitoring temperature across various zones. These readings are collected from NTC (Negative Temperature Coefficient) sensors strategically placed throughout the battery system.
This feature helps users monitor temperature consistency across the pack and quickly identify any anomalies such as overheating or sensor failures.
Features of the Zone Temperature Tile
- Bar Chart Display
Each vertical bar represents the temperature of a specific thermal zone in the battery pack. - Min/Max Indicators
The minimum and maximum temperature values are automatically identified and shown as floating labels in the top-right corner of the chart
This data is critical for identifying hotspots, cold zones, or sensor malfunctions inside the battery pack.
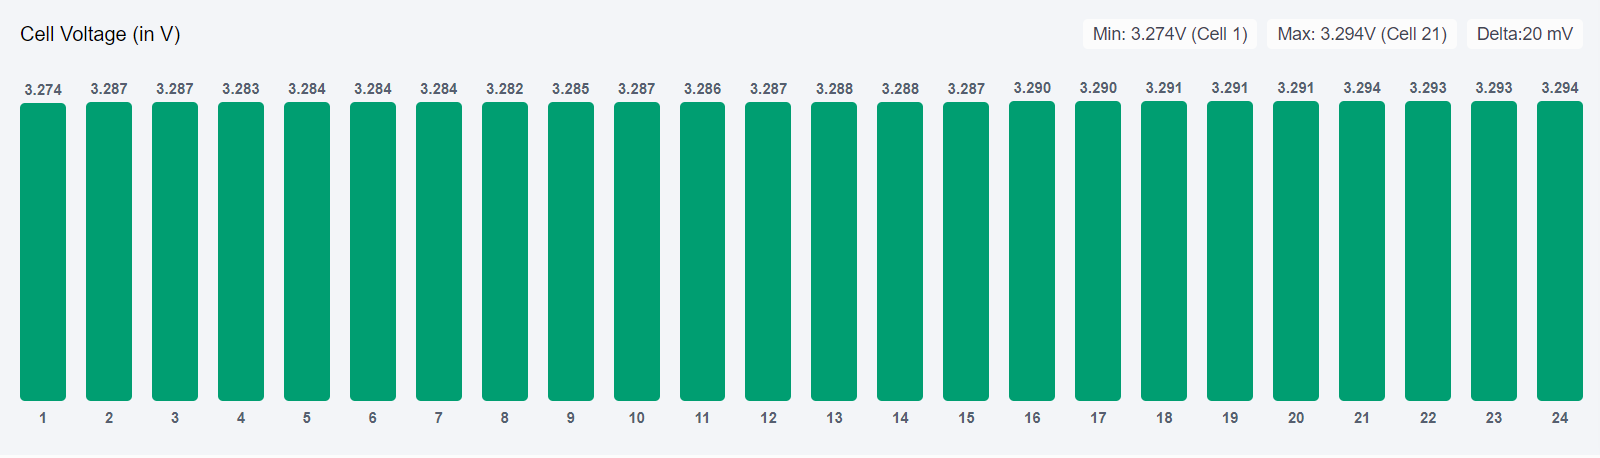
Cell Voltage
The Cell Voltage widget provides a real-time visual representation of the voltage levels of each cell in the battery pack. This helps users quickly identify imbalances, potential failures, or abnormal cell behavior — critical for battery health and safety.
Features of the Cell Voltage Tile
- Bar Graph Display
Each vertical bar represents one cell in the battery pack. The height of the bar corresponds to the voltage level of that cell. - Min, Max & Delta Display
In the top-right corner of the widget:- Min Voltage – Shows the lowest cell voltage and cell number
- Max Voltage – Shows the highest cell voltage and cell number
- Delta – The difference between the max and min voltages
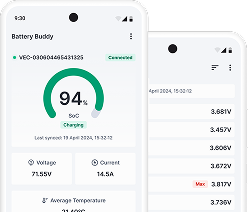
Device Status Ribbon
The Device Status Ribbon is located at the bottom of the Battery Buddy interface. It provides live metadata about the app’s connectivity and data freshness, helping users confirm system status at a glance.
Details Shown in the Status Ribbon:
- Connection Status
Indicates whether the app is currently connected to a device, along with the duration since the connection was established.
Example: Connected | Since 11 minutes ago - System Time and Date
Displays the local system time and date of your PC.
Example: 07-08-2025 | 1:33:44 PM - Last Updated
Shows when the dashboard last received updated data from the connected BMS.
Example: Last updated: Just now
This helps users verify that data shown on the dashboard is current and the device communication is stable.
