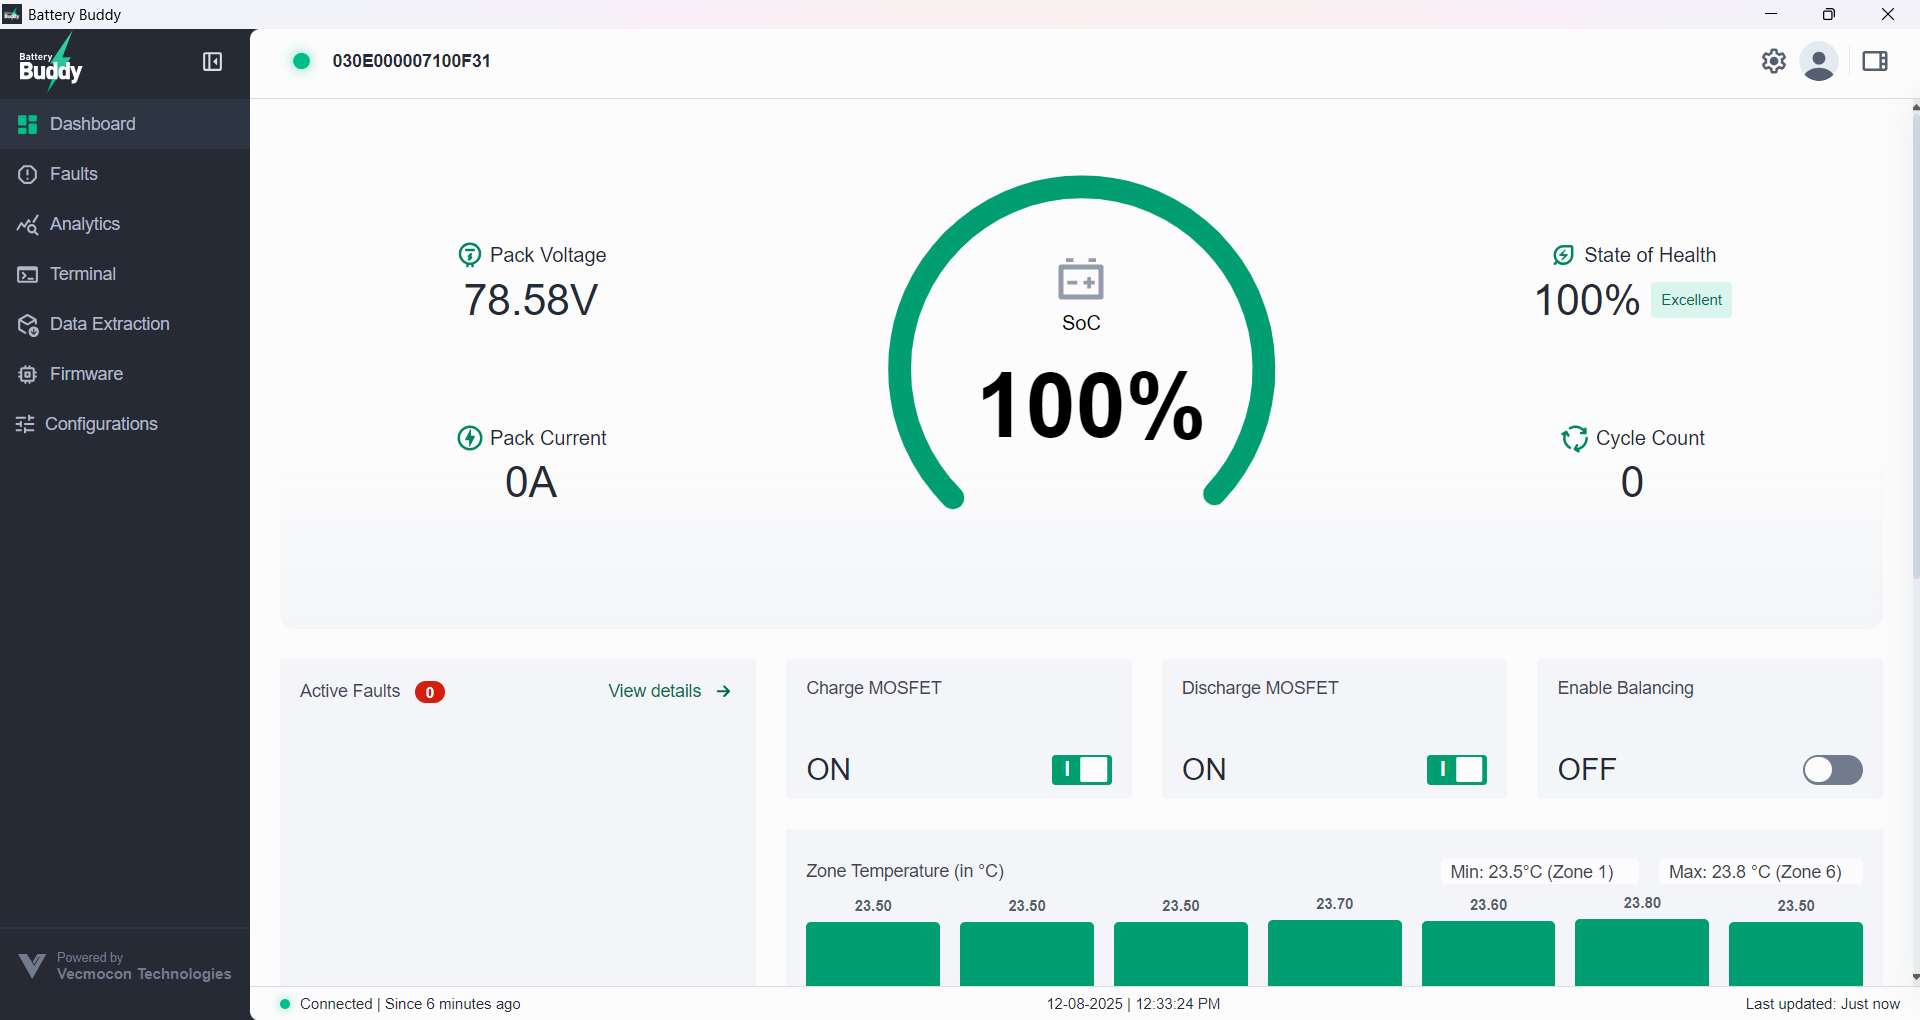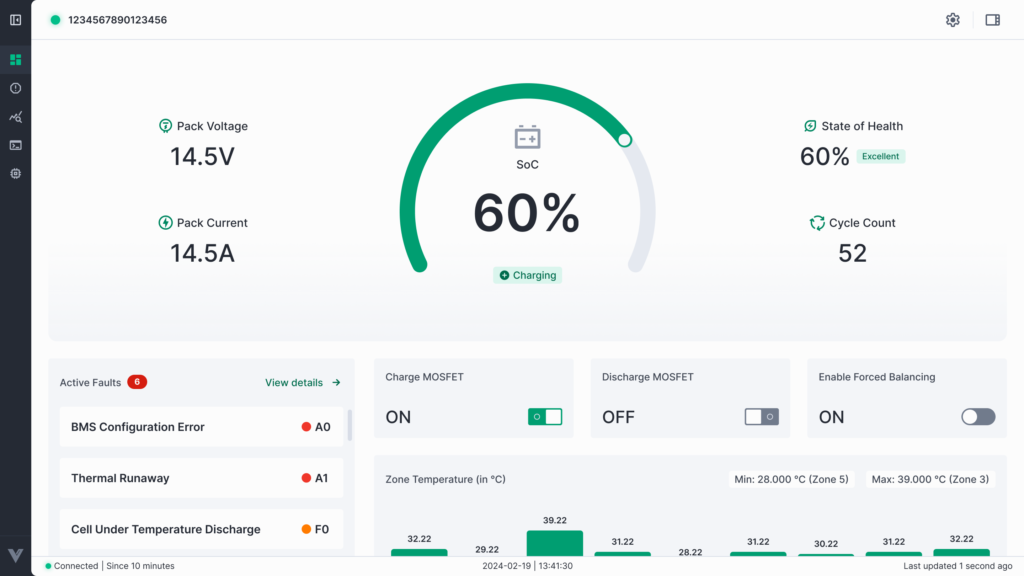
After launching Battery Buddy and establishing a connection with a battery device, users are taken to the main interface of the application. This section provides an overview of the application’s layout and how to access key modules.
Application Layout
The Battery Buddy interface is divided into three main sections:
1. Left Sidebar Navigation
This vertical panel on the left provides access to the app’s core modules:
- Dashboard – View real-time battery parameters
- Faults – Monitor active and historical system faults
- Analytics – Analyze historical performance and trends
- Terminal – Access low-level BMS communication tools
- Data Extraction – Export logs and historical datasets
- Firmware – Perform firmware upgrades
- Configurations – Manage and apply BMS settings
2. Top Bar
Located at the top of the application window, this bar provides:
- Connection Status – Displays the current connection status along with the unique Device ID of the connected battery (e.g., 4F0CF8F7C8FF56FX3). A green dot indicates active connection.
- Settings – Opens the Settings Panel, where users can:
- Enable/Disable real-time logs
- View or change the logs file save location
- Check the current installed app version (e.g., 1.0.3)
- Quick Access Panel – Opens a side panel with connected device information and the disconnect option. (Details covered in the Disconnecting a Device section.)
3. Main Content Area
This is the central panel where detailed information, charts, controls, and configuration options for each selected module are displayed.