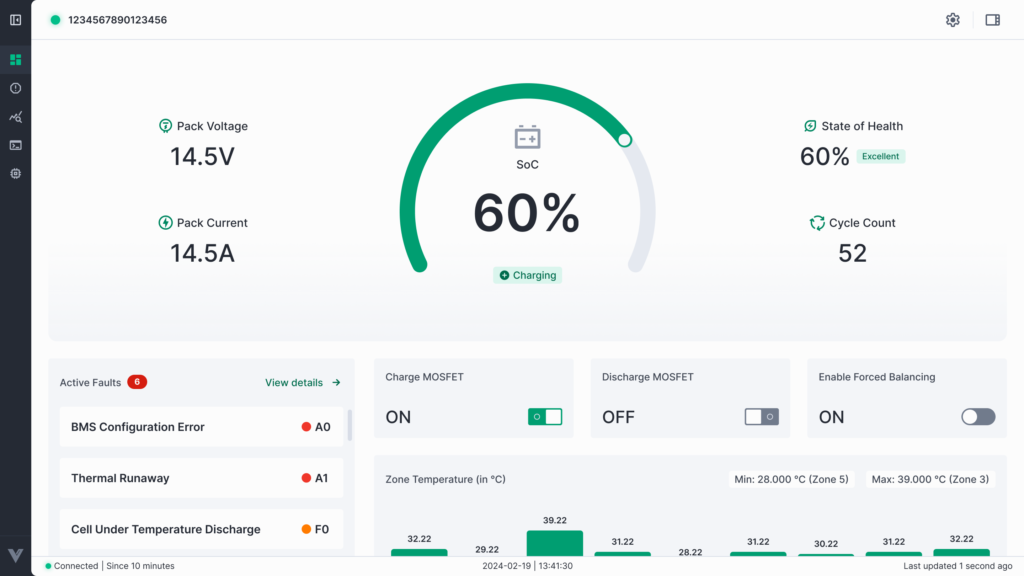
The Analytics module in Battery Buddy is designed to help users visualize and analyze the behavior of key battery parameters over time. It enables engineers and service teams to:
- Monitor real-time performance
- Compare parameter fluctuations
- Track trends across voltage, current, SoC, temperature, and other critical metrics
Analytics can be accessed from the left sidebar and offers two main viewing modes:
- Graph View – Real-time or historical plots of selected parameters
- Table View – Tabular display of recorded data with export functionality
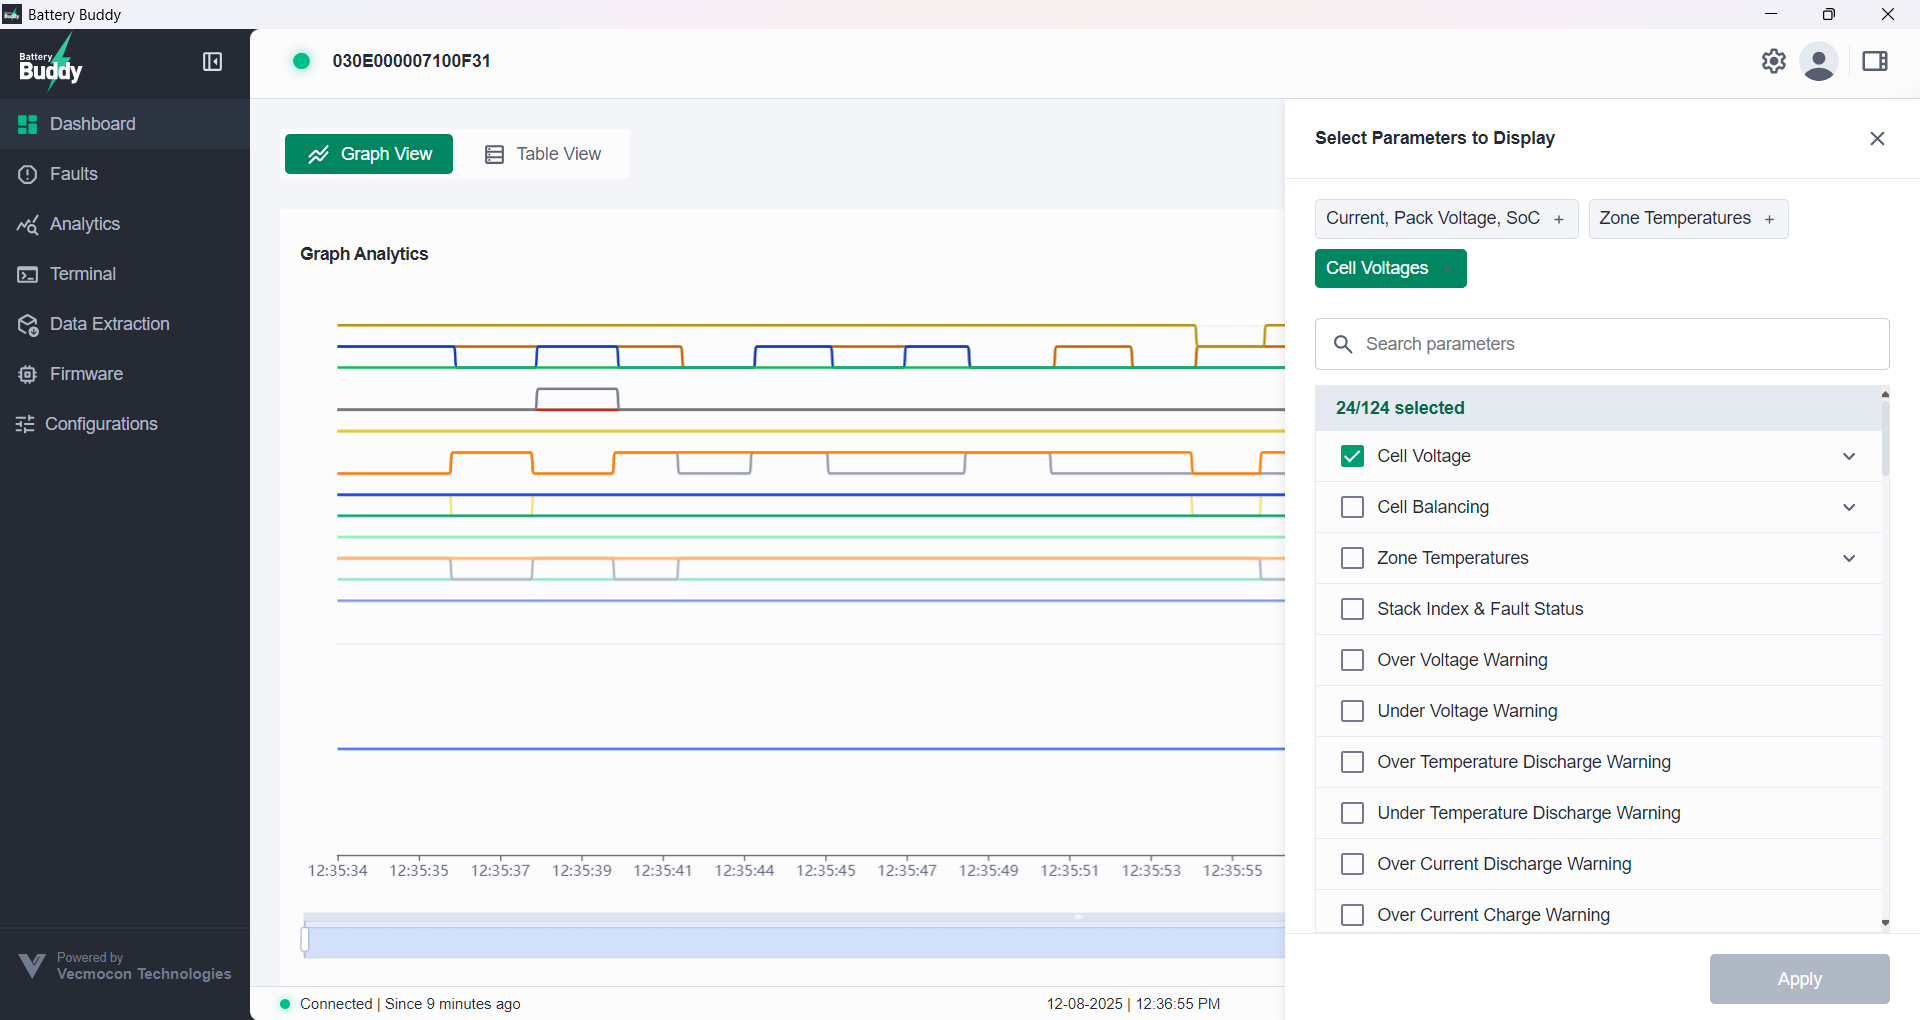
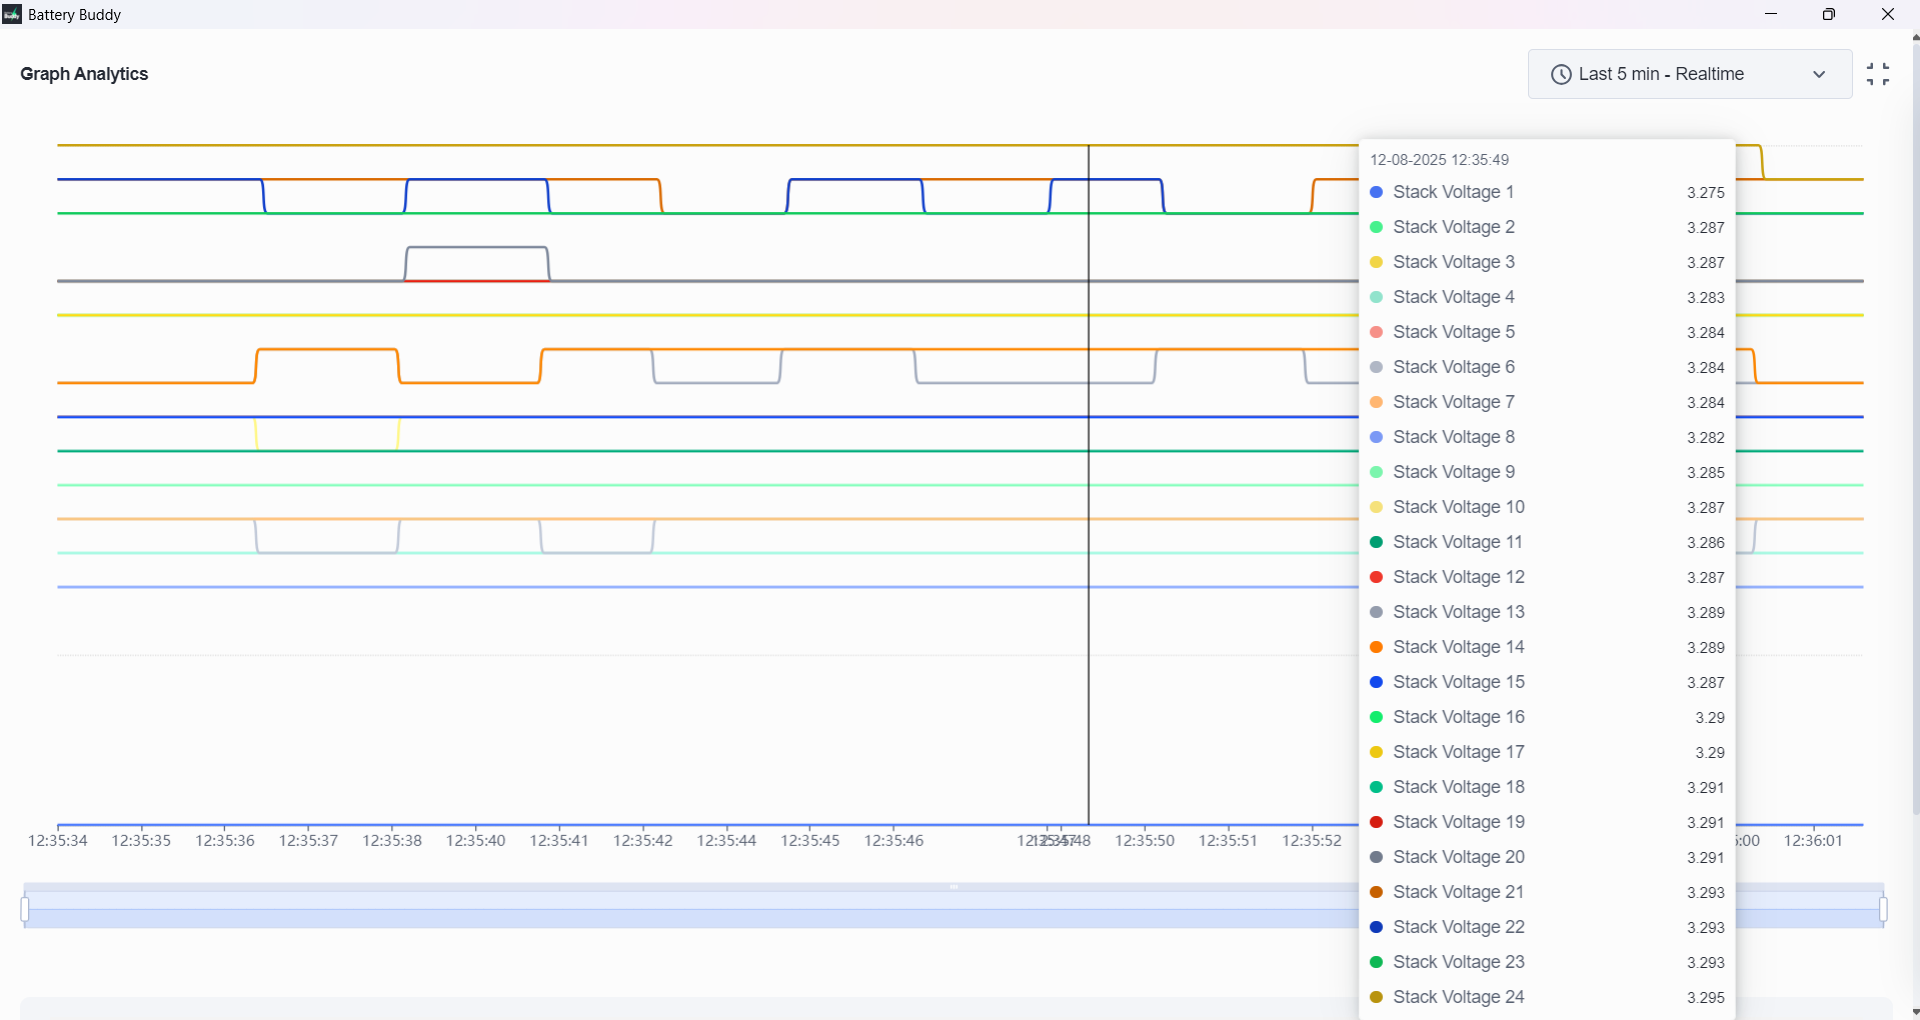
Graph View
The Graph View provides a real-time, interactive line chart that plots selected battery parameters against a time axis. It allows zooming, panning, parameter selection, and live tooltips for precise insights.
Key Features of Graph View
1. Parameter Selection
- Click the Select Parameters button to choose the metrics you want to plot (e.g., Pack Voltage, SOC, Current).
- You can select from grouped categories like Cell Voltage, Temperature, and Fault Warnings.
- Selected parameters appear as color-coded tags above the graph.
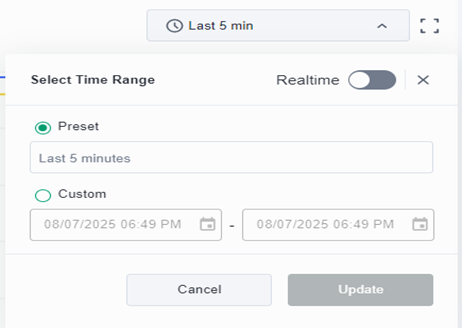
2. Time Range Selection
- Use the Time Range dropdown to set a view window.
- Options include:
- Preset: Last 5 minutes, 30 minutes, 1 hour, etc.
- Custom: Manually choose start and end timestamps.
- Toggle Real-time mode ON/OFF for live monitoring.
3. Interactive Graph & Hover Tooltips
- Hover anywhere on the graph to view parameter values at a specific time.
- A tooltip shows values for all selected parameters with exact timestamp.
- Lines are color-coded to match the parameter legend.
4. Zoom & Scroll Timeline
- A blue horizontal scroll bar below the chart enables zooming and panning.
- Stretch or drag the handles to focus on a narrower time window.

5. Parameter Summary Table
Below the graph, a table shows a summary of each parameter:
| Parameter | Latest | Min | Max |
| Pack Voltage | 59.03 V | 59.01 V | 59.04 V |
| Pack Current | 0.00 A | 0.00 A | 0.00 A |
| SOC | 56% | 56% | 56% |
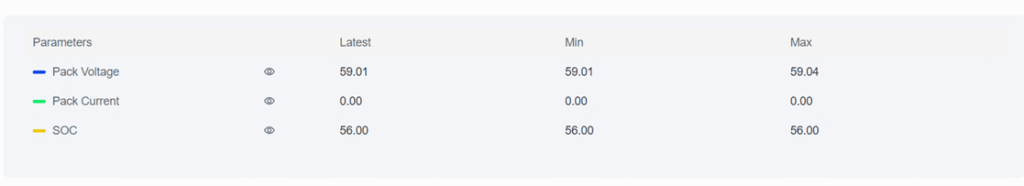
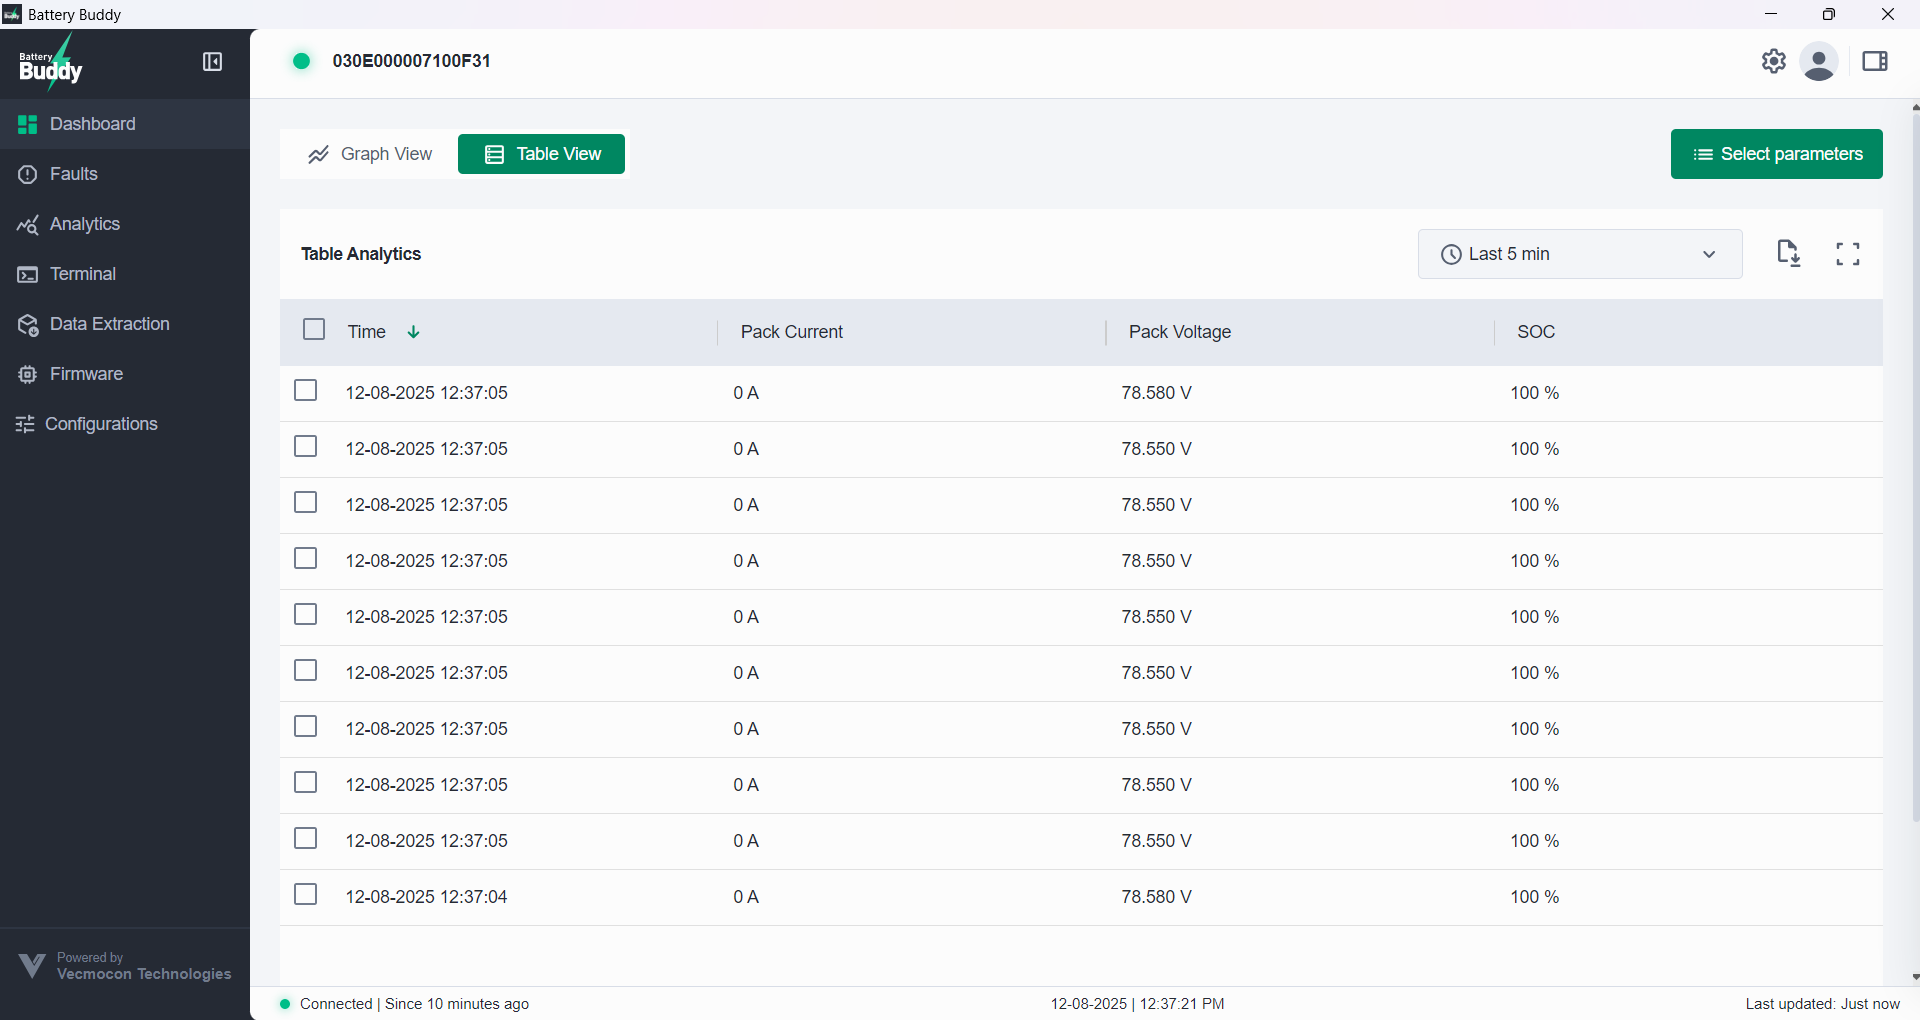
Table View
The Table View presents battery parameters in a timestamped, tabular format for detailed analysis. It allows parameter selection, time range adjustments, and exporting data to CSV for offline review.
Key Features of Table View
1. Timestamped Parameter Logs
Each row in the table represents a data snapshot captured at a specific timestamp.
- Columns include:
- Time
- Selected Parameters (e.g., Pack Voltage, Pack Current, SOC)
- Parameter values are displayed with appropriate units (e.g., V, A, %, etc.)
2. Parameter Selection & Time Range
The parameter selection panel and time range dropdown in Table View are the same as in Graph View.
- Use these controls to choose which parameters to display and set the time window for data.
- Real-time mode can be toggled ON/OFF.
For detailed steps, refer to the Graph View section.
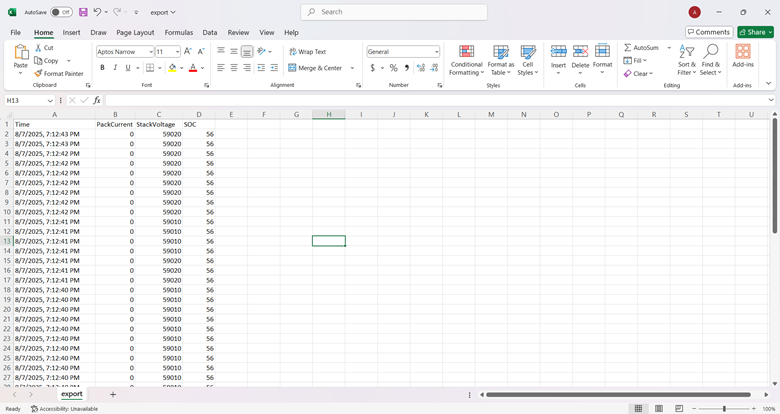
3. CSV Export
Click the Download icon (top-right) to export the visible table as a .CSV file.
- The exported file includes the timestamp and all selected parameters.
- Compatible with Excel, Google Sheets, and other spreadsheet tools.