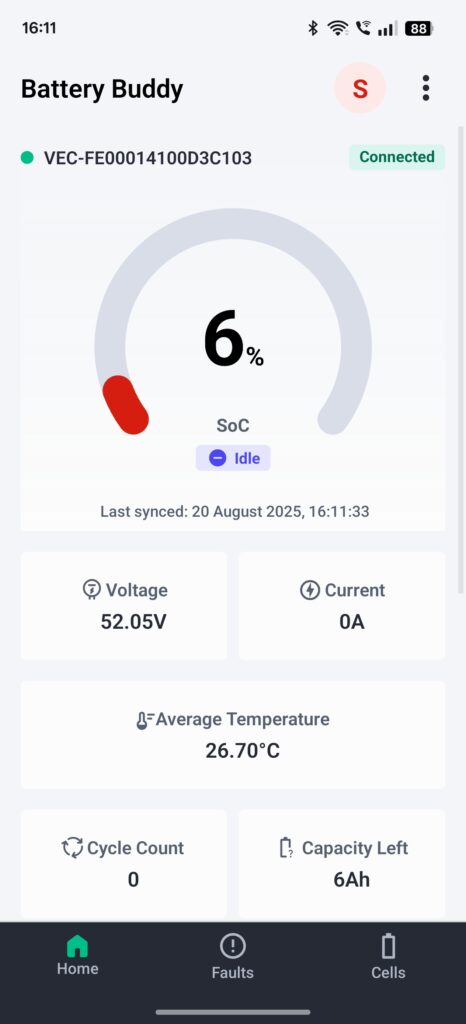
After launching the Battery Buddy mobile app and establishing a connection with your battery device over Bluetooth, users are taken to the Home Screen, which serves as the main interface for real-time monitoring. This section provides an overview of the app’s layout and how to access its core features.
Application Layout
The Battery Buddy mobile interface is divided into three main areas:
1. Bottom Navigation Bar
The navigation bar at the bottom of the screen provides quick access to the app’s primary modules:
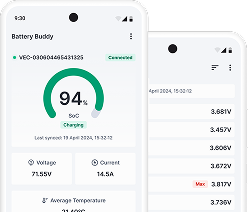
- Home – Displays real-time battery parameters such as SoC, Voltage, Current, Temperature, Cycle Count, and Capacity Left.
- Faults – View active and historical faults detected in the battery system.
- Cells – Provides detailed information on individual cell voltages and health.

2. Top Bar
Located at the top of the app, this bar provides:
- Connection Status – Shows the connected device ID (e.g., VEC-FE00014100D3C103) and the current status (Connected or Disconnected). A green dot indicates active connection, while a red dot means no device is connected.
- Profile Icon – Gives access to log out button.
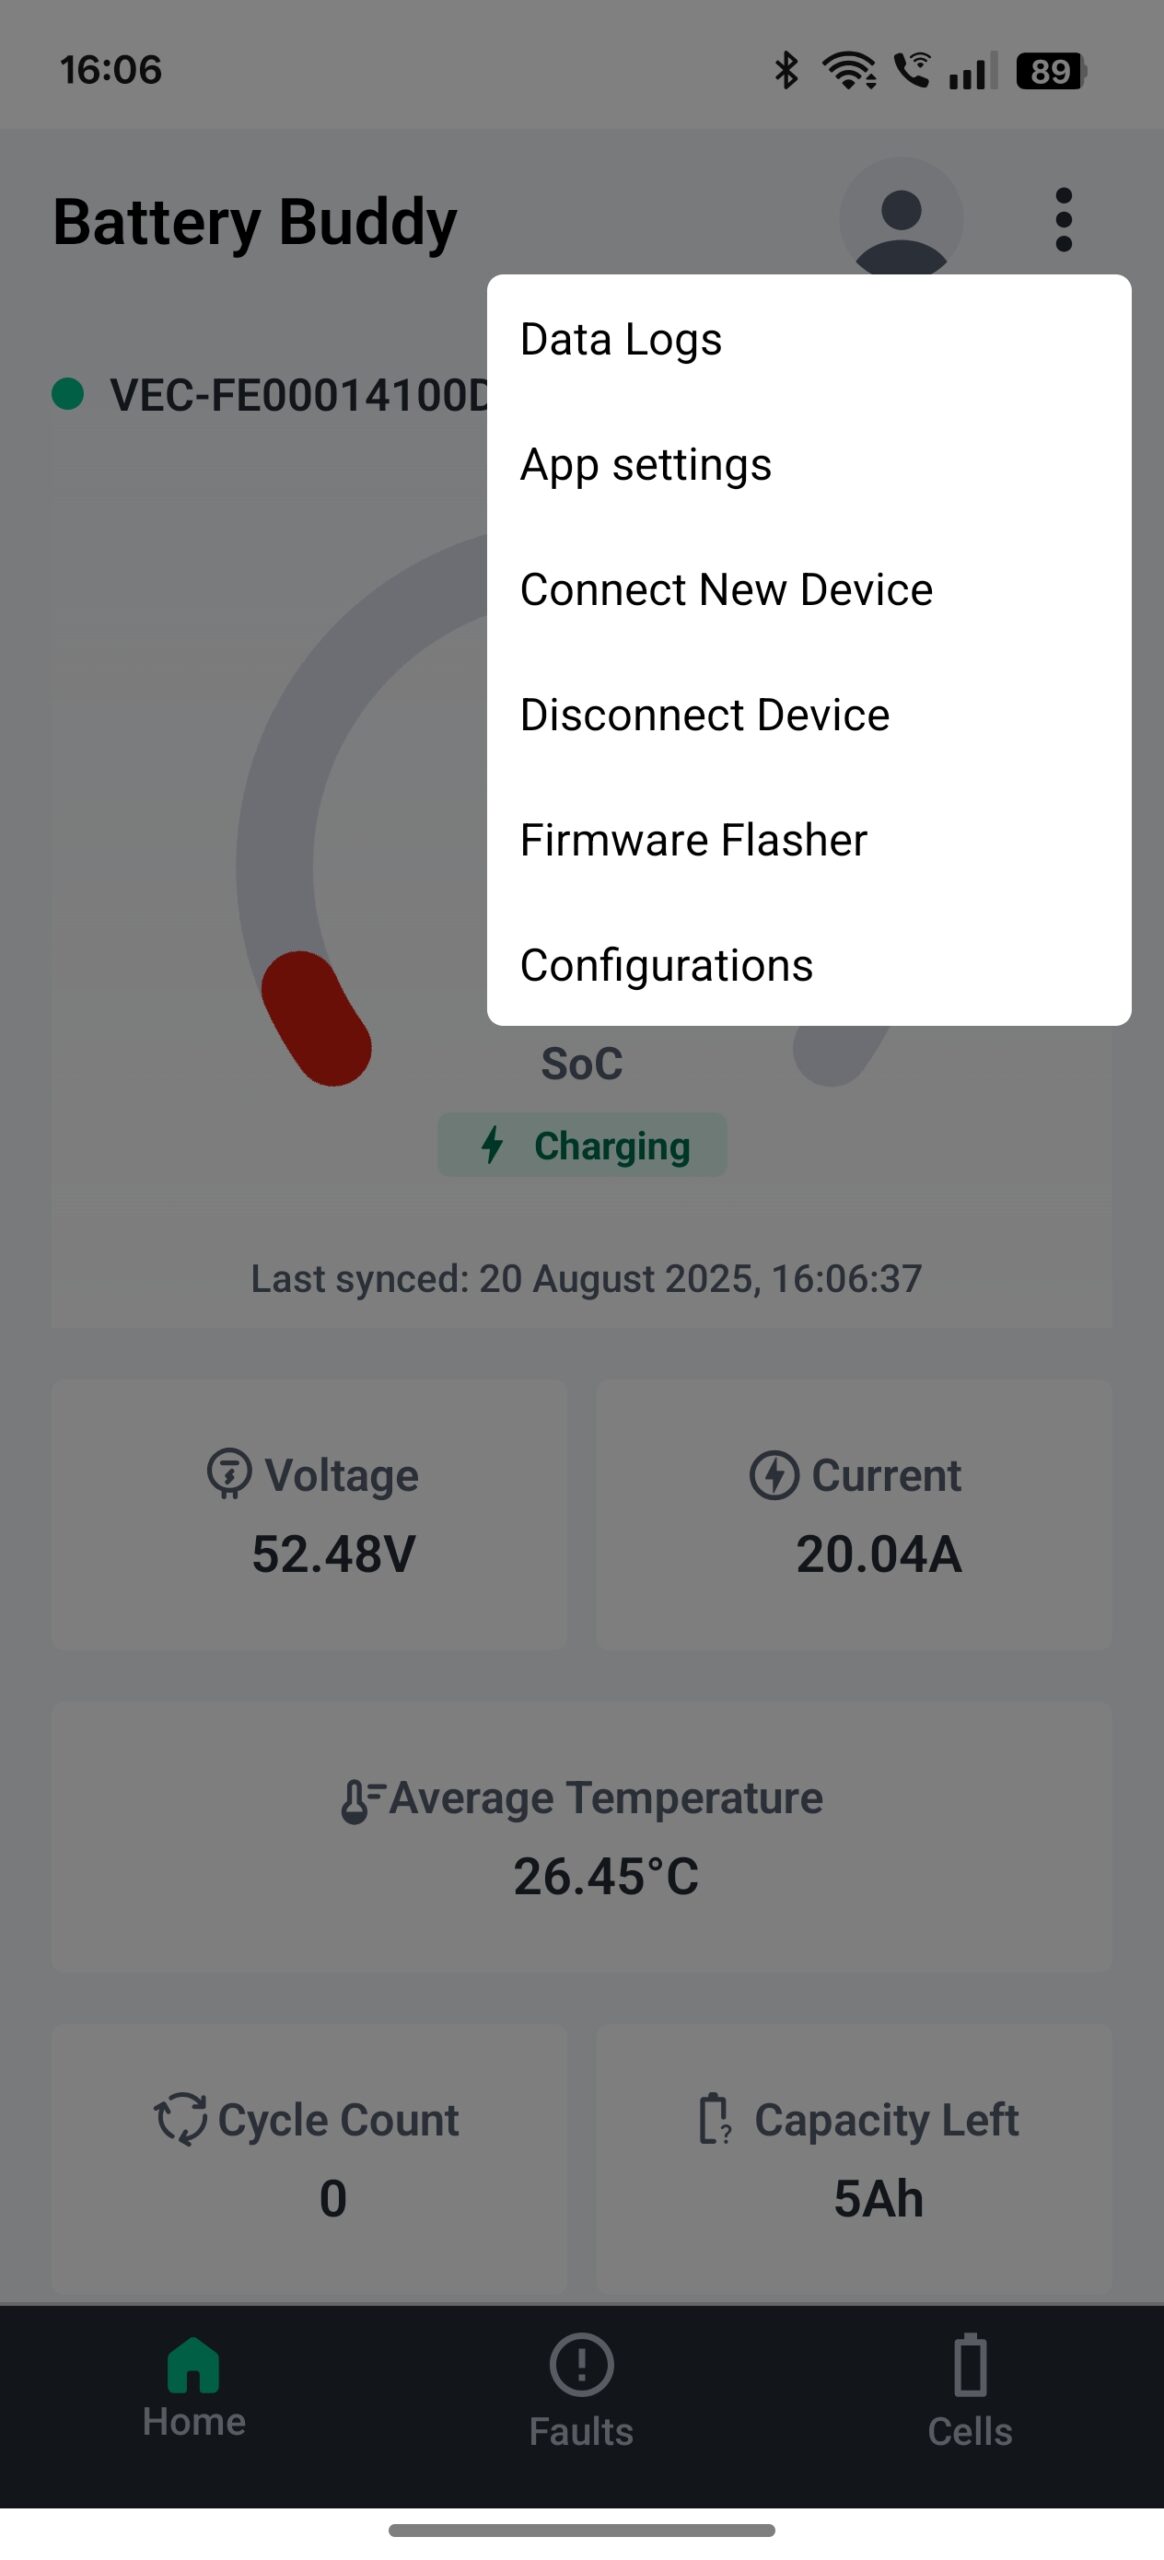
- Menu (three dots) – Provides quick access to additional tools:
- Data Logs
- App Settings
- Connect New Device
- Firmware Flasher
- Configurations
3. Main Content Area
The central part of the screen displays detailed information depending on the active tab:
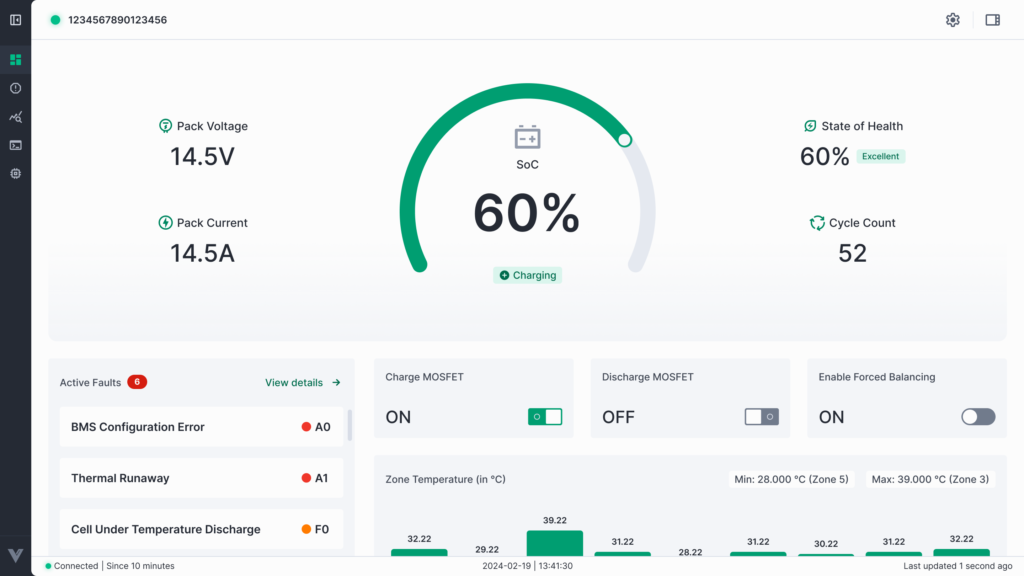
- On Home – Battery SoC gauge, Voltage, Current, Temperature, Cycle Count, and Capacity Left. Additional sections show Zone Temperatures and Battery Details (cell count, capacity, software version, production date).
- On Faults – List of active faults with timestamps and history.
- On Cells – Cell-level monitoring, showing voltage distribution and balancing status.